
CrimeGrade™ safety ratings for every neighborhood in America
See how safe any city or ZIP code is. CrimeGrade rates every neighborhood in the country from A to F, right down to the block.
Every state, every neighborhood. Or explore featured cities.
per year
per year
A full CrimeGrade report for any place
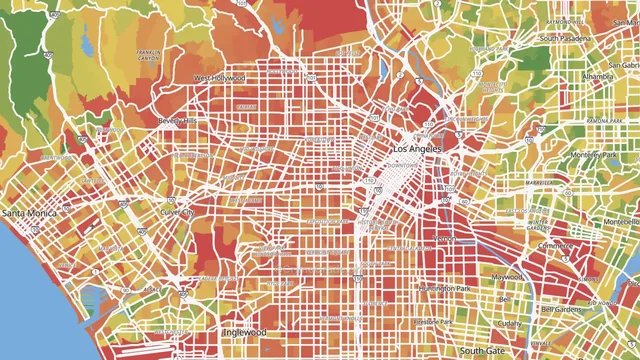
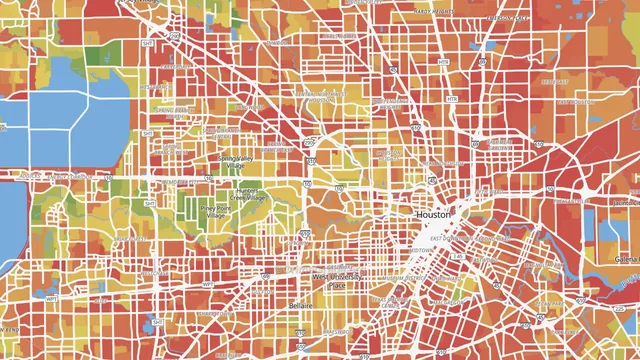
Every search returns a graded report card. See how a place scores overall, how it breaks down by type of crime, and how safety shifts from one block to the next.
- An overall safety grade from A+ to F
- Separate grades for violent, property, and other crime
- Cost of Crime per resident and per household
- Neighborhood and block-level maps shaded by safety
- The safest and least safe areas nearby
Grades reflect current-year projections and are reviewed as new data is released.
How CrimeGrade works
CrimeGrade ratings turn millions of crime records into a single letter, from A+ (safest) to F. Each rating is a percentile, so an A means a place is safer than most comparable locations. Ratings compare like with like: a neighborhood is measured against other neighborhoods, and a city against other cities.
Built from real reports
Records come from the FBI's Uniform Crime Reports and NIBRS, state criminal justice departments, and local police, then cleaned, geocoded, and standardized into one national dataset.
Weighted by harm
Each crime is weighted by its impact on a community, drawing on peer-reviewed research (McCollister, French, and Fang, 2010). A robbery counts far more than a minor theft.
Complete coverage
Where official reporting has gaps, a validated model fills them using demographic, geographic, and historical patterns, so every area carries a grade.
CrimeGrade ratings in major cities
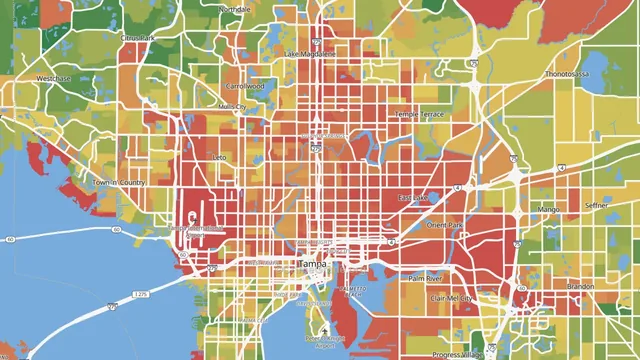
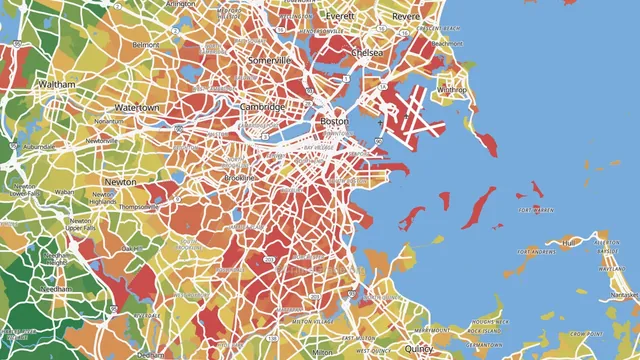
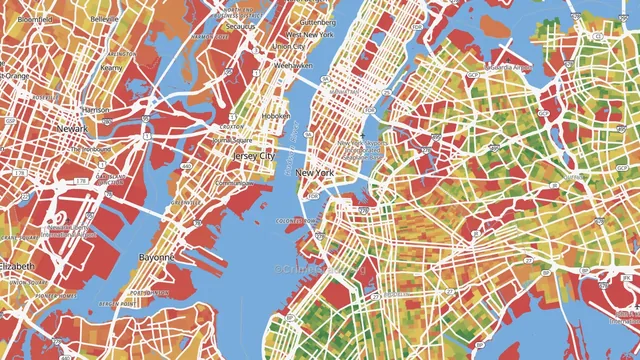
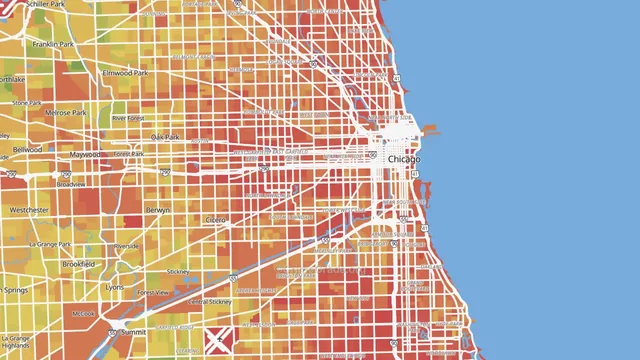
Six major metros, best to worst, so you can see the scale at work. Or search any place above.
Data for business, guidance for home
CrimeGrade data licensing
The same data behind these ratings is licensed to insurers, lenders, real estate platforms, and researchers. It is available by individual crime type and down to areas of about 1,500 people, delivered through an API or flat files.
Enterprise clients can go further. We layer in additional datasets and build custom models around your portfolio, your markets, and the risk questions you actually need answered.
Crime Data LicensingHome security
Independent reviews of home security systems, with recommendations that stay independent of income. Compare options and find what fits the neighborhood you live in.
Home Security SystemsWe may earn a commission when you choose a provider through these links. It does not affect our recommendations.
CrimeGrade™
Safety ratings for every neighborhood in America.
CrimeGrade™ is a trademark of [Owner Name]. All rights reserved.